Buses, Roads and Trams: A Comparative Assessment of Economic Value
“Trams are often criticised for not making a profit, yet roads also operate at a loss—and, when judged through the same economic lens, roads consistently perform worse. On equal terms, trams prove superior. While buses are essential for integration within city tram networks, they do not deliver the same economic returns or productivity improvements as trams.”
1. Executive Summary
Roads are fully subsidised, generate no direct operating income, and impose significant public costs through congestion, accidents, pollution, and lost productivity.
In contrast, modern tram systems:
-
Recover some operating costs through fares.
-
Deliver measurable employment growth and business clustering.
-
Improve urban productivity via higher employment density.
-
Shift significant numbers from cars, reducing congestion.
-
Promote inclusion—particularly in underserved communities.
-
Face stricter financial scrutiny under the Transport and Works Act Order (TWAO), which requires secured funding and a positive economic case. By contrast, road schemes are appraised using COBA but are funded directly from government budgets without the same requirement to demonstrate a financial return [10][12].
Although buses remain vital as connectors within a wider transport network—linking communities into tram and rail corridors—they fall short in delivering the same scale of modal shift, economic uplift, or productivity improvements if operated as standalone systems.
2. UK Transport Accessibility in Context
The Centre for Cities finds that only 40% of residents in large UK cities can reach their city centre within 30 minutes by public transport, compared with 67% in comparable Western European cities [11]. This limited access reduces “effective city size” and costs the UK economy an estimated £23.1 billion annually in lost productivity [11].
For example, Rome and Manchester are similar in population, but Rome is 55% more productive, in part because its transport system provides far greater accessibility [11].
These findings reinforce that compact, high-capacity transit such as trams is vital to address the UK’s productivity gap. Reliance on buses and cars, as has been the case in the UK, is comparatively inefficient and acts as a drag on the economy.
3. Evidence for Tram Advantages
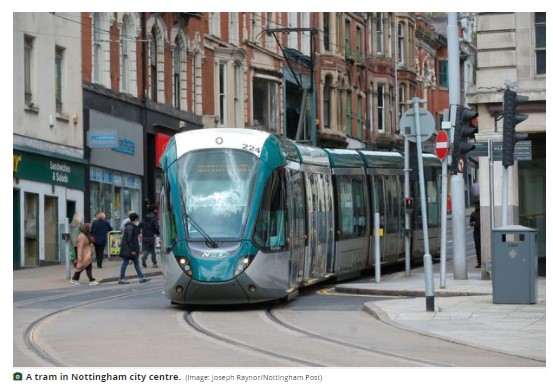
Nottingham Express Transit (NET): Phases 1 & 2
-
Phase 1 (2004): Employment rose 11.6% within 400 m of tram stops—versus 1.9% in control areas [1].
-
Phase 2 (2015): Extensions further stimulated business clustering and regeneration [2].
Productivity
-
A 10% increase in employment density delivers 0.9–1% productivity growth—enabled by improved access through trams [3][4].
Modal Shift
-
Tram systems achieved a 20–30% modal shift from cars, compared to 4–6.5% for buses [5], further supported by Nottingham’s “Green Wave” signal pre-emption [6].
Property Value & Regeneration
-
Light rail proximity corresponds with a +6.4% increase in home values [7].
-
Croydon Tramlink delivered tangible uplift and inward investment [8].
Space Efficiency
-
Trams require just 1/5 the road space of buses and 1/12th that of cars to move the same number of people [9].
4. Comparative Snapshot
| Aspect | Roads | Trams | Buses |
|---|---|---|---|
| Direct revenue | None—fully subsidised | Partial via fares; broader socio-economic returns | Partial fares; limited returns |
| Employment impact | None | +11.6% near NET stops [1] | Limited |
| Productivity | Eroded by congestion | +0.9–1% per 10% density increase [3][4] | Neutral/weak |
| Modal shift | Poor | 20–30% from cars [5][6] | 4–6.5% shift [5] |
| Property values | Neutral | +6.4% uplift [7] | Minimal impact |
| Regeneration & inclusion | Limited | Strong (e.g. Croydon) [8] | Limited |
| Space efficiency | Low road-use efficiency | High (1/5 bus; 1/12 car) [9] | Better than cars, worse than trams |
| Funding scrutiny | COBA appraisal, no ROI requirement [12] | TWAO requires proof of secured capital and ROI [10] | No equivalent scrutiny |
| Accessibility (30-min) | 40% of residents [11] | Expands effective city size [11] | Supports reach but weaker than trams |
5. Financial Scrutiny of Roads vs Trams
-
Roads: Evaluated via COBA (Cost–Benefit Analysis), which quantifies user benefits such as time savings, accident reductions, and vehicle operating costs. However, COBA does not require roads to generate a direct financial return. Road schemes are funded from government budgets even with modest benefit–cost ratios [12].
As Professor Lewis Lesley notes, drawing on evidence from the Town and Country Planning Association and the Strong Towns movement, once a basic road network is in place, further expansion “merely attracts additional traffic and worsens the economics of the road network” [10]. This is the classic problem of induced demand—capacity generates traffic, not lasting relief.
-
Trams: Under TWAO, promoters must demonstrate a positive Benefit–Cost Ratio (under HM Treasury’s Green Book rules) and show that capital funding is already secured. This makes the approval threshold for trams stricter than for roads [10].
Myth-buster: “Motoring taxes pay for roads” (the fuel duty fallacy)
-
In the UK, fuel duty goes into general taxation and is not hypothecated for roads. Since 2020, Vehicle Excise Duty (VED) has been hypothecated to the National Roads Fund—but this mainly supports England’s Strategic Road Network and does not cover the wider cost of the local road network.
-
Saying motoring taxes “pay for roads” is like claiming alcohol duty pays to maintain pubs: both are general taxes, not service-specific fees. Even with VED hypothecation, most road spending is still subsidised and congestion costs remain unpriced [10][13][14][15].
6. Conclusion
-
Roads: necessary but permanently subsidised, prone to induced demand, and weak in generating long-term economic value.
-
Trams: partially self-financing, rigorously scrutinised under TWAO, and consistently generate major economic returns in employment, productivity, regeneration, and property value—while bridging the UK’s accessibility gap.
-
Buses: indispensable when integrated into tram and rail networks to extend coverage and ensure feeder access, but unable to deliver standalone transformative impact.
Reliance on buses and cars alone, as has been typical in the UK, is comparatively inefficient and acts as a drag on the economy. By contrast, trams should be recognised as strategic economic infrastructure—like the police, judiciary, NHS, or defence—essential for elevating UK cities to European productivity standards.
References
-
Mott MacDonald (2014). Transformative Impacts of Transport Investment: Nottingham Express Transit. Department for Transport.
-
Rossiter, W., et al. (2015). NET Phase Two Local Economic Evaluation. Nottingham Trent University.
-
Graham, D.J. & Gibbons, S. (2019). “The Effect of Agglomeration on Firm and Worker Productivity.” Regional Science & Urban Economics, 78, 203–219.
-
Cervero, R. (2001). “Transport and Land Use: The Interface.” Journal of Transport Geography, 9(1), 1–19.
-
UK Parliament Transport Committee (2020). Modal Shift and Traffic Reduction: Evidence Report.
-
Jacobs Engineering (2021). Green Wave Corridor Pre-emption Performance, Nottingham.
-
Li, H. & Chen, J. (2018). “The Impact of Light Rail Transit on Property Values: A Meta-Analysis.” Journal of Transport Geography, 69, 1–10.
-
Knowles, R.D. (2004). “Transport Impacts of the Croydon Tramlink.” Journal of Transport Geography, 12(4), 275–287; Siraut, J. (2004). Economic and Regeneration Impacts of Croydon Tramlink. WIT Press.
-
Walmsley, D.A. (2018). What Trams Can Do for Cities. Light Rail Transit Association (LRTA). Available at: https://www.lrta.org/wp-content/uploads/2020/05/1.-What-Trams-Can-do-for-Cities.pdf
-
Lesley, L. (2023–25). Professor Lewis Lesley, transport consultant; formerly Professor of Civil & Transport Engineering, Technical Director of Tram Power Ltd, and advisor on UK light rail policy. Commentary on road/tram economics, 1963 Road Research Laboratory study, induced demand, TCPA & Strong Towns references, fuel duty fallacy, and TWAO funding frameworks.
-
Centre for Cities (2021). Measuring Up: Comparing Public Transport in UK and European Cities. Centre for Cities, London. Available at: https://www.centreforcities.org/reader/measuring-up-comparing-public-transport-uk-europe-cities/
-
Department for Transport (various years). COBA: Cost Benefit Analysis for Highway Schemes. DfT appraisal guidance.
-
House of Commons Library (2024). Road and Vehicle FAQs (CBP-9322).
-
House of Lords Library (2020). Funding roads: Coming full circle?
-
Institute for Fiscal Studies (2021). A road map for motoring taxation.


